"Select smaller region for testing" Tool Only Accepts Square and Rectangular Selections #48
Comments
|
Hey Austin, unfortunately, there are no other region selections available at the moment. The purpose of this selction is to provide a cropped image to test the detection parameters faster, before you then analyze the entire image. I assume that you would like to restrict your analysis to sub-region (e.g. your blood vessel). while this was possible in the old version of FISH-quant (Matlab), we took a different approach here. in the underlying Python library (big-fish), the entire image will be analyzed. In a post-processing step (as you already know), these results can then be assigned to certain regions (cells, nuclei). is this approach not working for you? |
|
Hi @muellerflorian - thank you for the clarification. that's very helpful! It seems like the cell numbers are assigned from the top of the mask down. So if I wanted to restrict my analysis to just cells in a circular region, I might have to only include say cell 5, 8, 23, 43 etc. Is there a way to display the cell_id number on the mask so that one could easily figure out which cells to include or exclude for region-restricted analysis? Right now, it's difficult to tell which cell in the mask corresponds to say cell_id #10. |
|
i guess this could be done with a script, where we plot the segmentation results and on top the cell id (or nuclei id). would this work for you? @Henley13, do you have a script that does this kind of plots? if not, I can try to put something together. |
|
I don't have a dedicated script for that, but if you show the segmentation mask in Fiji, Kaibu, whatever, I guess you can see the value used for each cell mask by moving the mouse over the cells, no ? |
|
Ok. I don't think an inspection with FIJI like this is very practical. I will check and see if I can find some old code. For another project, I created plots like the one shown below. would this work for you, @austinlandgraf ? @Henley13. do you think we could/should add this to big-fish? might be useful for others as well in order spatially identify the cells/nuclei based on their index?
|

|
Hi @muellerflorian @Henley13 A plot like the example you showed would be very helpful - thank you for working on this! |
|
Hey @austinlandgraf, I added a new plugin that should help. you can install it this should give an image like that
i also updated the documentation, but somehow it is currently not correctly build. what you need to do in the plugin You only have to paste the path to folder containing the segmentation results (usually a folder called
The plugin will then create a new subfolder called Let me know if this works for you! best |

|
Hi @muellerflorian , the plugin works perfectly! Thank you for you releasing this new feature! I think it's going to be very helpful for analyzing images. |
Describe the bug
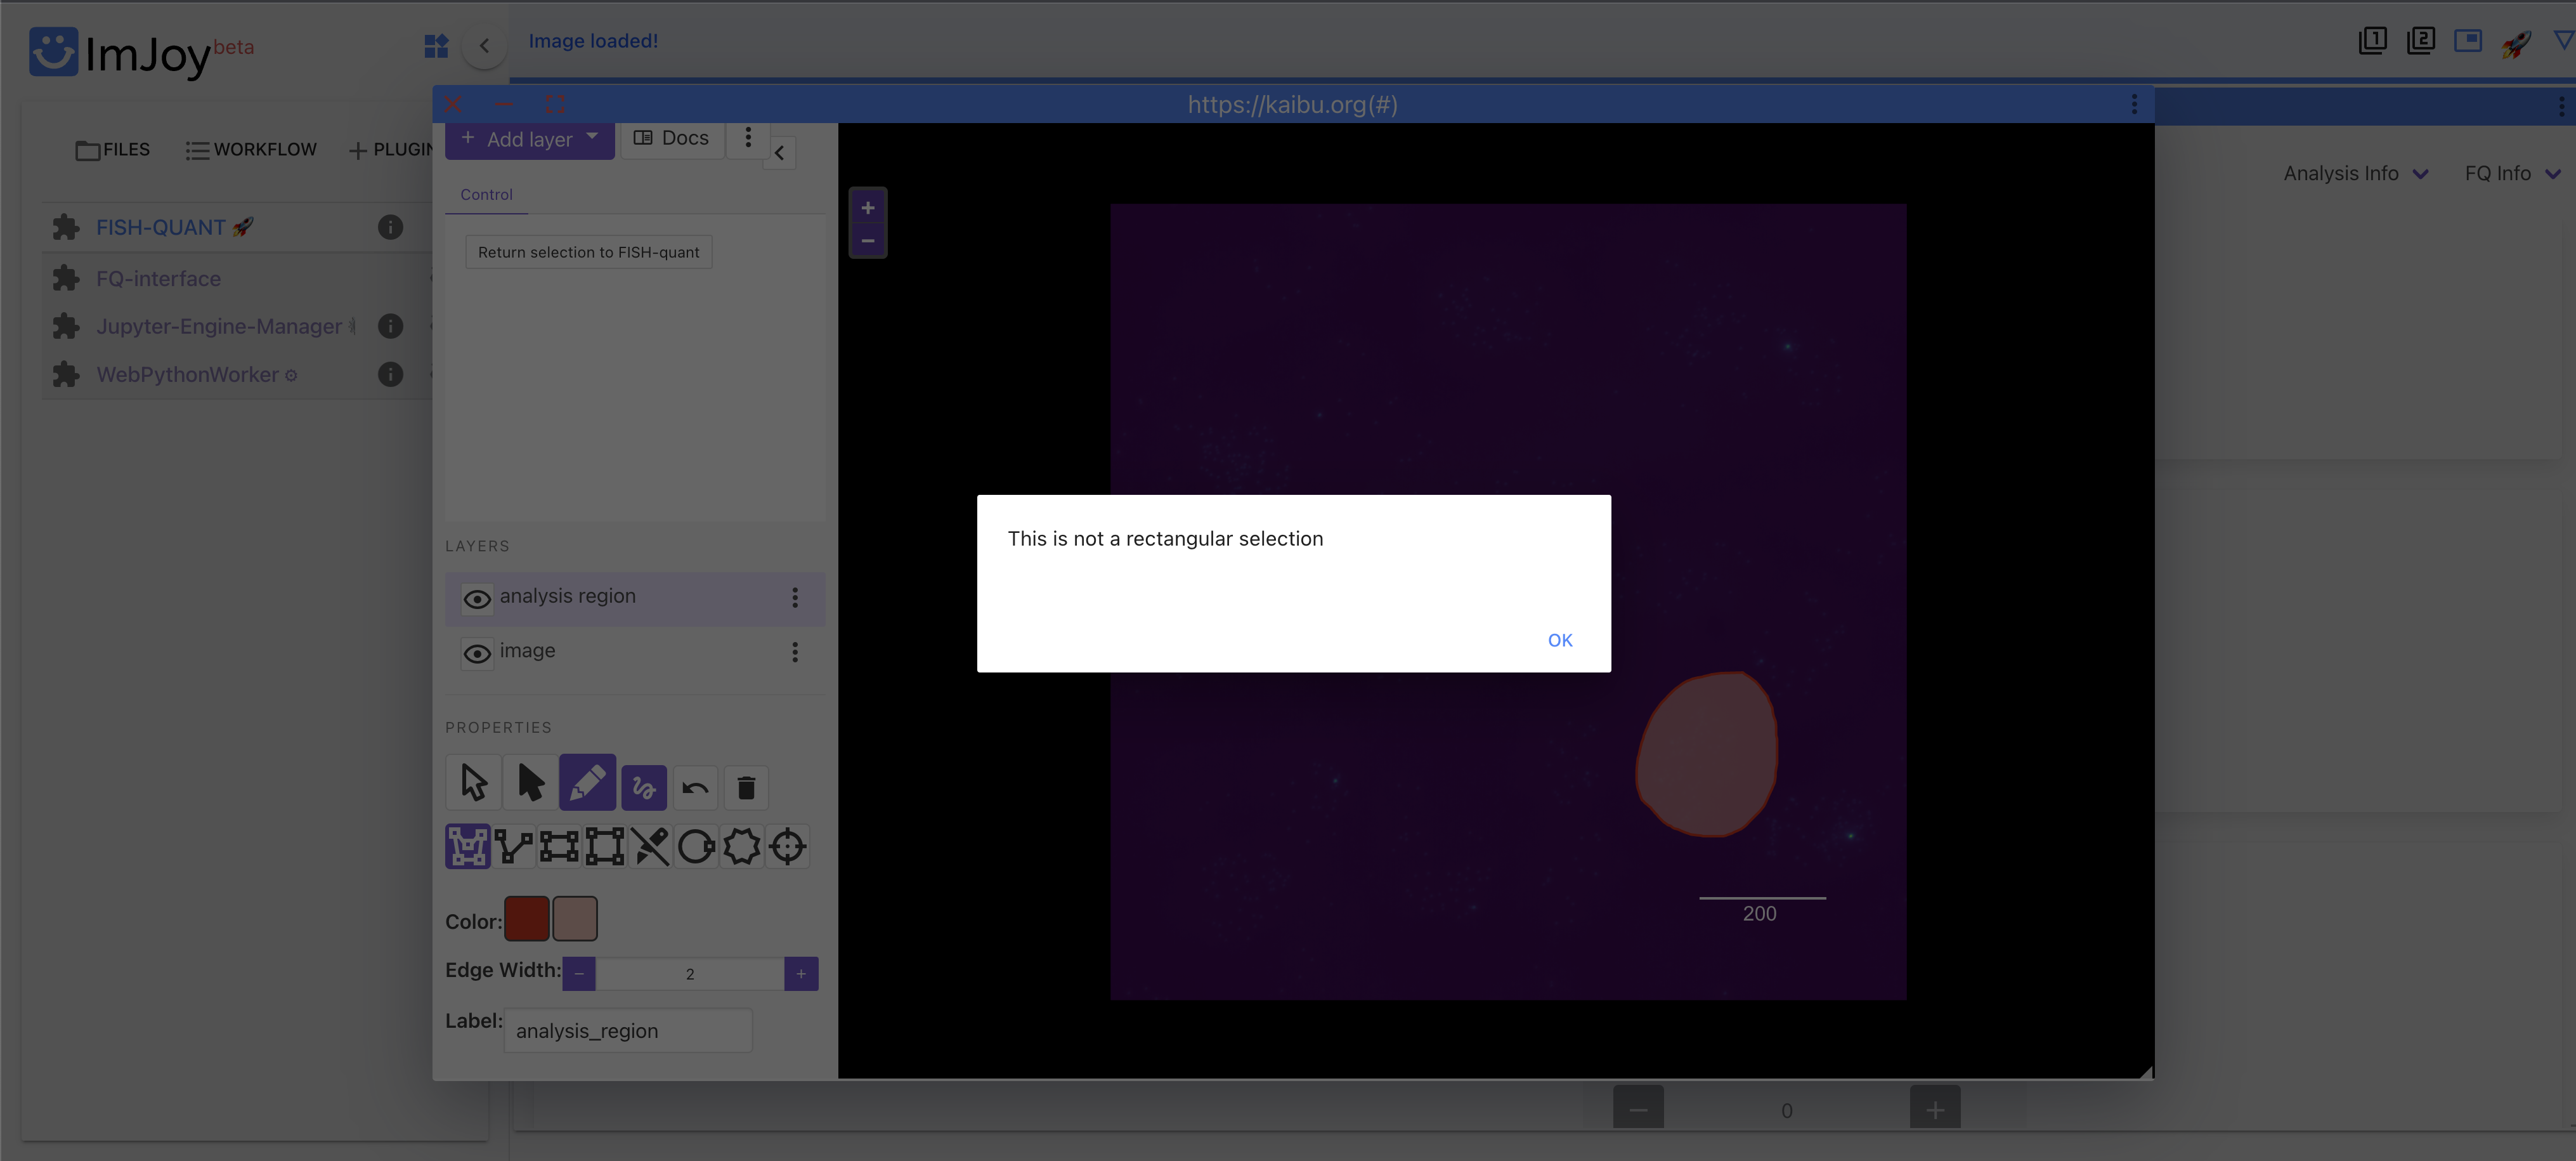
I'm trying to use the "Select smaller region for testing" tool under the "Spot Detection" tab to only analyze one layer of cells surrounding a blood vessel (roughly a circular selection). When I attempt to select this region using the "Circle" tool and then click "Return selection to FISH-QUANT", I get the error message in Kaibu, "Annotation has to be a Polygon." When I then try the "Polygon" tool, I get the error message "This is not a rectangular selection". The only two tools the seem to work are the "Rectangle" and the "Square" tools. Are these really the only supported selection methods in Kaibu?
To Reproduce
Logs
browser console log.docx
plugin log.docx
Screenshots
Versions:
iOS 11.6.2
Chrome Version 99.0.4844.51
FQ plugin: v0.0.16
FQ interface: v0.0.11
big-fish: v0.6.0
The text was updated successfully, but these errors were encountered: