![]()
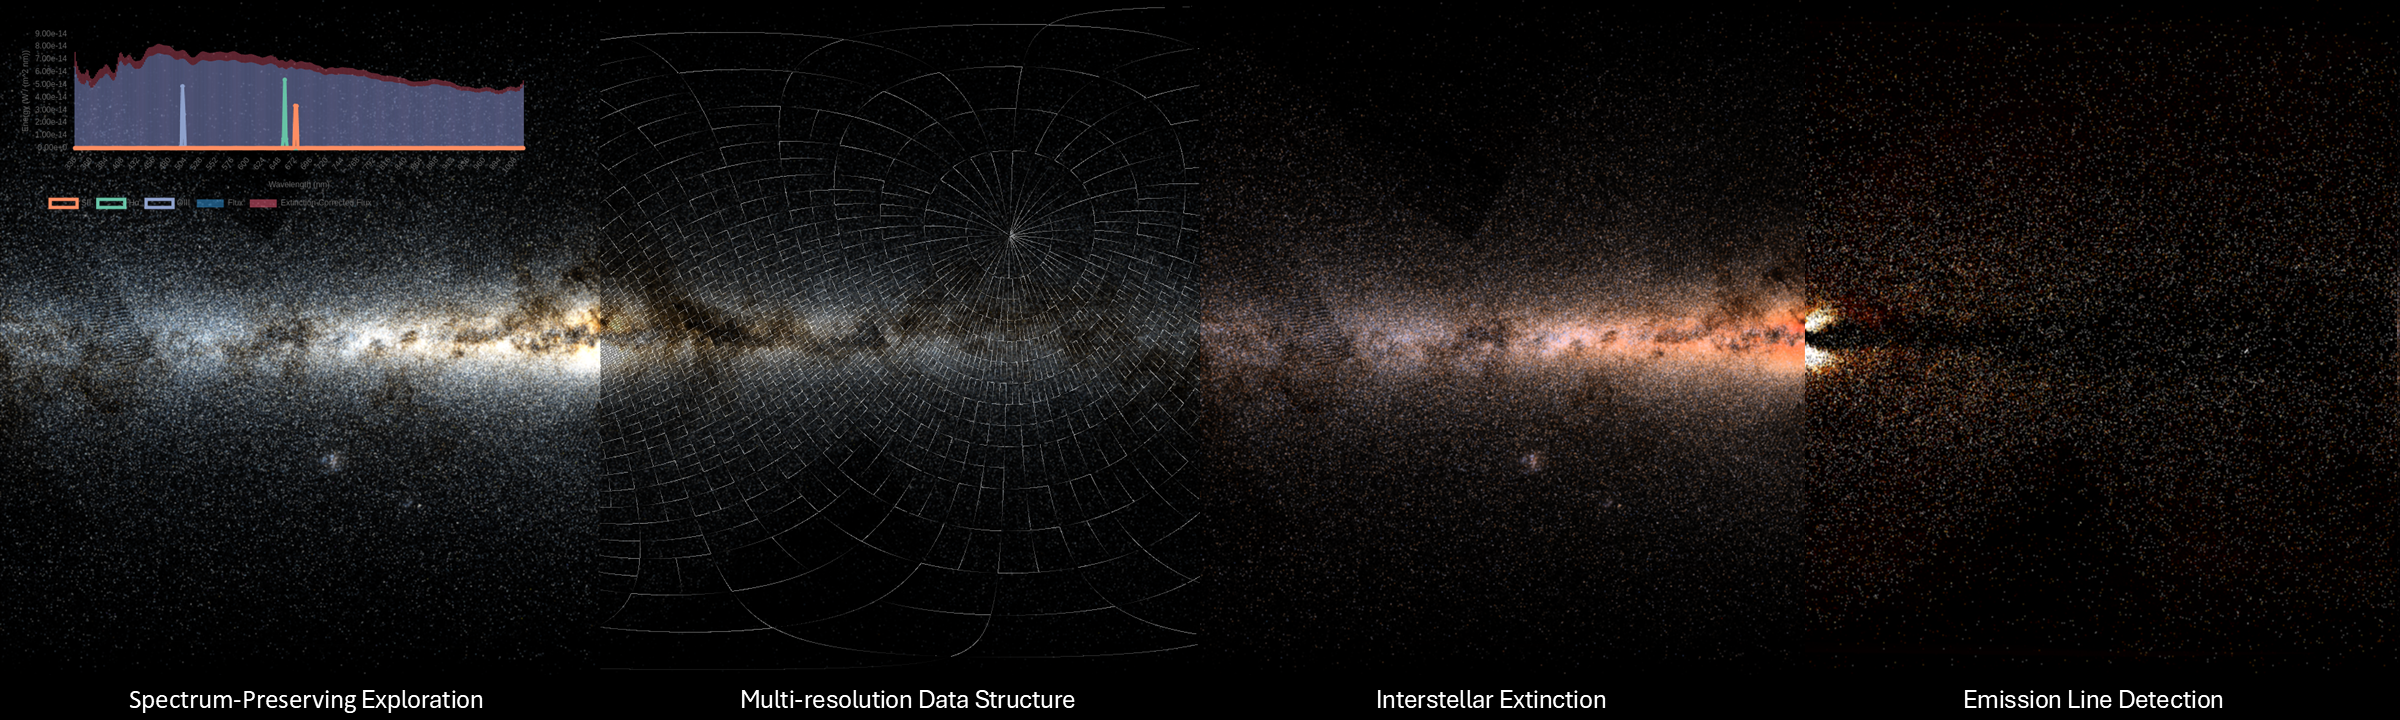
This repository contains an open-source, web-based implementation of Lactea, a submitted paper to the EuroVis 2025 conference introducing a spectral visualization, multi-resolution technique for a large star catalog. This repository works with the European Space Agency (ESA)'s GAIA catalog, which contains the spectral information of almost 2 billion stars.
script folder contains a Python script to download the 3rd release of GAIA. After making a virtual environment, install gaiaxpy as well as numpy and pandas. gaiaxpy is used to sample the continuous spectrum.
Once the environment is set up, run the Python script to generate a folder with 3386 files. Lastly, merge them all into one big file before moving to the next step.
An example bash script of all these steps is available at script/download.sh.
The data structure building tool is written in C++. The core library is available at data_structure/src/lactea_xp_merged. Other scripts are also available to sort, sample, build, and chunk the tree.
To build a WebGPU-friendly tree:
Run raw_star_db_sorter_xp_merged.cpp to sort the merged binary file based on the magnitude using alveko's external_sort library.
The script takes two arguments:
- input file name: the name of the merged file obtained from the previous step (e.g.,
/data/gdr3_gaia_source_xp_extinction.stars) - output file name: the sorted filename (e.g.,
/data/gdr3_gaia_source_xp_extinction_sorted.stars)
Make subsets of the data using raw_star_db_subset_writer_xp_merged.cpp. There are 3 input parameters:
- the sorted file to sample (e.g.,
/data/gdr3_gaia_source_xp_extinction_sorted.stars) - output file name: (e.g.
/data/gdr3_gaia_source_xp_extinction_1M.stars) - number of stars: how many star samples (e.g.,
1000000)
Once the data is sorted (and sampled if desired), build the tree and save it as chunks using sandbox.cpp. 4 arguments are required:
- the sorted file: could be the whole database or a sampled database (e.g.,
/data/gdr3_gaia_source_xp_extinction_1M.stars) - the output tree file: This only saves the tree structure. (e.g.,
/data/gdr3_gaia_source_xp_extinction_1M.str) - the chunks output directory: the directory to save each node chunk for WebGPU visualization. (e.g.,
/data/gdr3_gaia_source_xp_extinction_1M) - The max number of stars per node: In the paper,
1000stars per node is used. This generates chunks of size5.6 MB, which is suitable for fetching on the web
It is also possible to divide this into two subtasks using star_tree_builder_xp_merged.cpp and star_tree_chunker_xp_merged.cpp)
A sample of the chunked data folder is available in web_visualizer/res/data, using 10,000 samples due to GitHub's file size restriction.
The visualization is implemented using WebGPU for accessibility. lil-gui, chart js, d3 and glmatrix were used.
The shaders are available in web_visualizer/res/shaders, while the main JS code is in web_visualizer/src.
A minimal JS implementation of the C++ lactea library is in web_visualizer/src/lactea. Change line 10 of web_visualizer/src/lactea/StarTree.js to reflect your served data path.
 // TODO: put your own data folder
 this.path = "http://127.0.0.1:5501/gdr3_gaia_source_xp_extinction/"
The components of the visualizer are:
LacteaInterface.js: this class connects to lactea, builds the viewbounds based on the camera parameters, traverses the tree, and builds the star and patch queues.LacteaCache.js: a lactea interface instance is created, as well as the star and node caches.cacheLoadfunction manages the queues, file loading, and the CPU and GPU caches.PipelineStarCompute.js: The star accumulation compute shader.PipelineNodeCompute.js: Storing the patch ID into the spectral buffer pipelinePipelineRender.js: rendering, tone mapping, and the different astronomical tasks pipeline. Once the spectral buffer is filled, any task, such as rendering, image processing, derivative computation or any other astronomical spectral processing task can be computed in a negligible timeLacteaVisualizer.js: entry point of the visualizer
To cite this work
@article{alghamdi2025Lactea,
 title = {Lactea: Web-Based Spectrum-Preserving Multi-Resolution Visualization of the GAIA Star Catalog},
 author = {Alghamdi, Reem and Hadwiger, Markus and Reina, Guido and Jaspe-Villanueva, Alberto},
 journal = {Computer Graphics Forum (Proceedings of Eurographics Conference on Visualization 2025)},
 year = {2025},
 volume = {44},
 number = {3},
 pages = {to appear}
}
This work has made use of data from the European Space Agency (ESA) mission Gaia, processed by the Gaia Data Processing and Analysis Consortium (DPAC).